See nearly all of Hubble’s observations in one amazing composite photo
One curious physicist made quick work of 936,000 observations covering 0.8% of the sky.
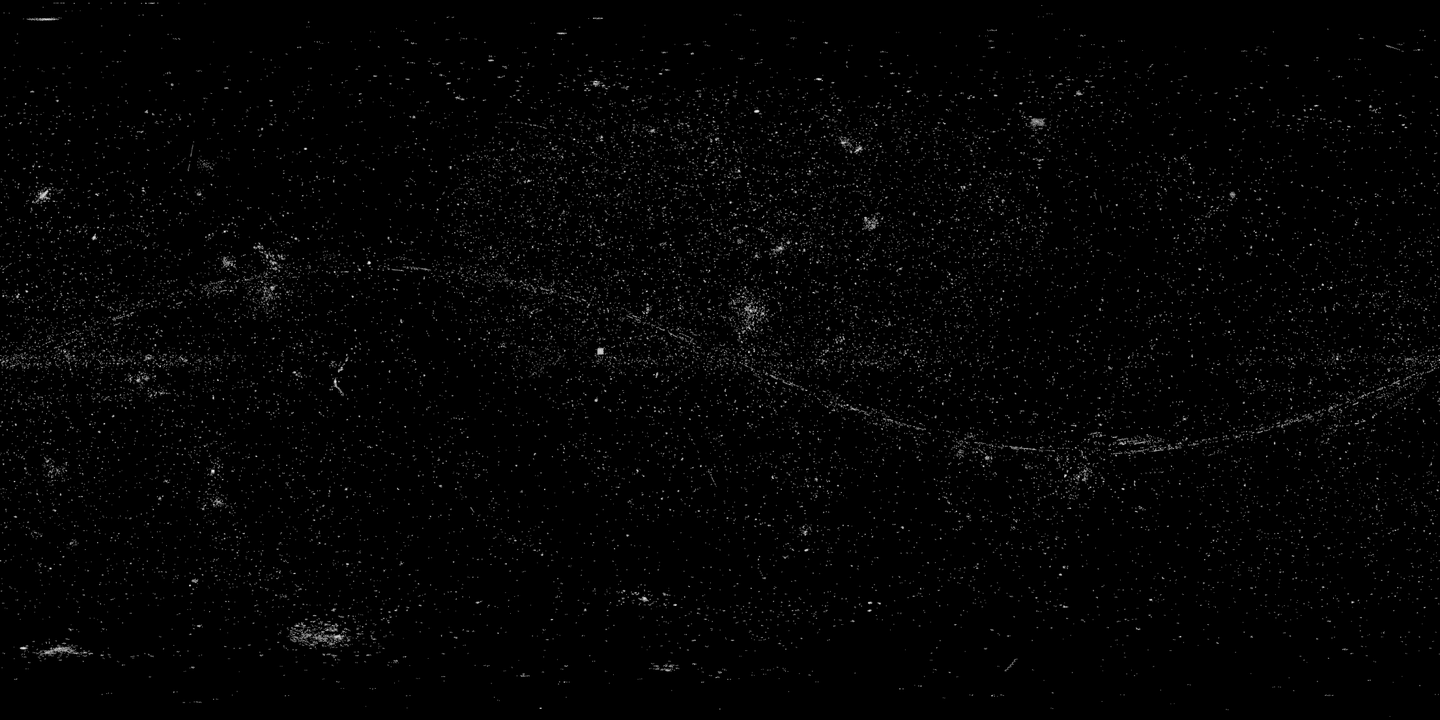
Since its launch in 1990, the Hubble Space Telescope has recorded over 1.3 million observations of deep space. One curious physicist, Dr. Casey Handmer, took it upon himself to create a stunning composite image of a majority of those observations, which puts the solar system on brilliant display.
What the image shows
Related: Photographer captures a ‘once-in-a-lifetime image’ of astronauts spacewalking outside the ISS
Viewers will immediately notice the curved line running the length of the image—according to Dr. Handmer, who holds a Ph.D. in Theoretical and Mathematical Physics from CalTech, that’s the ecliptic (plane of orbit) of our solar system.
“These are planets, asteroids, moons,” he explains. “Their planes vary a little bit so the curved line is actually a family of nearby lines.”
Further examination reveals a dark U-shaped curve crossing the middle of the frame, which, he adds, is the galactic plane.
“Even though our galaxy is full of interesting stuff, it’s also full of dust which probably obscures a lot of more distant sources. Other obvious features include nearby galaxies such as the large and small Magellanic clouds in the lower left, and the Andromeda galaxy,” Dr. Handmer notes.
After pulling together the composite, he was surprised to find that so much of the ecliptic was visible and that the total sky coverage amounted to 0.8%. “I’m not sure whether I expected much more or much less,” he says.
How he did it
“While Hubble wasn’t intended to perform all-sky surveys, I was interested in calculating how many observations would be needed to cover the entire sky and it turns out to be about 3.5 million,” Dr. Handmer says.
He then began scouring online databases for information about where the Hubble had made its observations. His wife, Dr. Christine Moran, pointed out that the Python astropy has an API that contains all the information required. After adapting some examples in the documentation and pulling together a script, Dr. Handmer was able to pull all the sky locations of the observations since Hubble’s launch. He then decided to experiment with graphical representations of the data, which produced the final image.
Of the roughly 1.3 to 1.4 million (depending on the source) observations, the database used by Dr. Handmer covers 936,000, which amounts to about 0.8% of the entire sky.
“Of course, while Hubble has imaging instruments, many observations are focused on spectroscopy, which is looking at the rainbow spectrum of light produced by the object under study,” he points out. “But I think it’s fair to say that light from 0.8% of the sky has hit the imaging plane of Hubble.”
While his final image shows a broad swath of formations (impressive at just 0.8%), he does have a few favorites.
“My personal favorite observations are the various Hubble deep field images, in which otherwise blank sections of the sky turned out, after weeks of integrating data, to be crammed with dim, distant galaxies each full of trillions of stars. It’s impossible to look at that image and not experience vertigo.”
