Visualizing How Viral Images Propagate On Facebook
Ever wanted to see how an image spreads on Facebook?
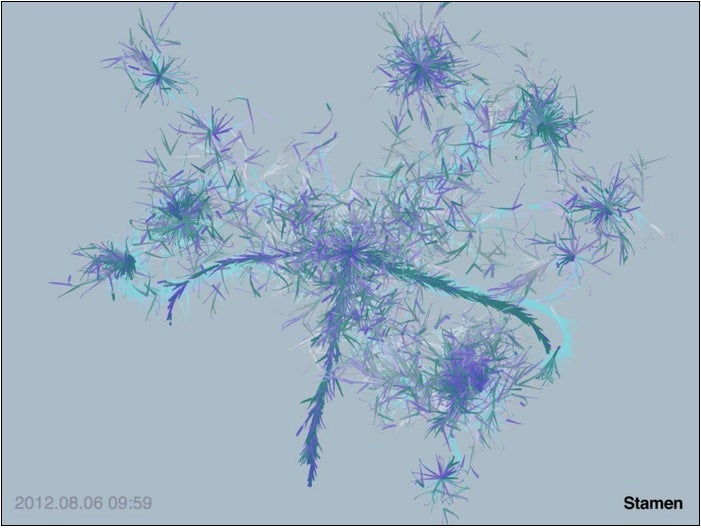
The folks at Stamen Designs have put together a very cool visualisation — they’ve mapped the viral spread of images over Facebook. Based on three images posted on George Takei’s incredibly popular page, they tracked how three images got shared and re-shared via thousands of people.
The video above is from Takei’s post of Marvin the Martian, which was shared more than 300,000 times. The data visualization tracked the images movements for three months, from July to September.
While not quite as graphically gorgeous as this, Google+ users have something very similar built into that social network. Google+ Ripples can track the spread of any post on Google+ — here’s a pretty gnarly example of a post that’s been shared and reshared dozens of times.
[via Gizmodo, Flowing Data]