Benjamin Grant’s satellite abstractions
“I think there’s actually a new way to see the planet through this.”
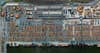
Southern California Logistics Airport Graveyard
In 2013 as he prepared a presentation for his local space club, Benjamin Grant called up a mapping program on his computer and typed in “Earth,” looking for a distant satellite image of the globe. “The map had indeed settled on Earth—Earth, Texas,” Grant writes in the intro of his new book, Overview (Amphoto Books). “I was astounded by what I saw. My screen had filled with a stunning patchwork of green and brown circles.”
Conceptually, the image—an aerial of dozens of irrigation fields watered by sprinklers in circular patterns—opened a spigot for Grant. This view of Earth was small yet vast, real but aesthetically abstract, environmentally telling, and emblematic of what writer Frank White called the Overview Effect regarding astronauts’ views of the planet: “From a distant vantage point one has the chance to appreciate our home as a whole, to reflect on its beauty and its fragility all at once,” Grant says.
Not long after, Grant set up a blog called the Daily Overview, posting diurnal views from programs such as Apple Maps and Google Earth with commentary on the locations, usually inspired by ecological concerns. “The underlying environmental story is something I’m passionate about,” Grant tells American Photo. “I hope to use this project to make an impact.” Magnified by his Instagram feed and other social media, the blog attracted a global audience and led to interest for print sales and gallery shows, which prompted Grant to secure rights for original hi-res satellite image files—allowing him to create highly detailed composites for the series.
The latest result is Grant’s 288-page monograph, a tour de force of research and image presentation, as well as plans for large-scale exhibitions. Here Grant talks about the genesis, methods and organic growth of his ongoing art project.
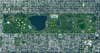
Central Park
How did you get the rights to run all these pictures?
It’s an interesting legal story in terms of who owns what and how this all happened. I’ve set up a partnership with DigitalGlobe—they operate a constellation of the highest-resolution satellite cameras. I take their raw imagery and raw data and clean it up, manipulate it, and stitch it together to create the pictures you see in the book. I discovered their imagery through Apple Maps—companies like Apple and Google use DigitalGlobe’s satellite shots for their aerial views. It was quite an adventure to figure out who owns what and who I needed to call and ultimately what was available. But they’ve been an amazing partner and made the entire book and project possible.
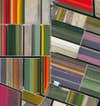
Tulips
So originally this was for your blog, where you do a daily post?
Exactly. It was before the book and before I started selling them as prints, before any money was involved. Later after our licensing agreement I started using [DigitalGlobe’s] software directly—which enables me to get the full resolution of an image. When you’re looking at Google Earth or any of those mapping programs, what you see is limited by the resolution of your computer screen or phone screen, but there’s a lot more information there, with all the layers of zoom. So by working with them I’m able to download all of that information and then stitch images together for the full effect.
How did you convince them that you had good intentions?
I remember the phone call exactly. They were like, “What do you want to do with these things?” Their normal customers are government agencies, agricultural monitoring, reconnaissance…. They get a phone call from this kid in New York who says, “I want to create art out of this,” and they say, “We’re going to do a background check quickly.” So they did a check and everything cleared out. But there was definitely some convincing at first for me to say, “I think there’s actually a new way to see the planet through this.” After months of negotiation, and as the Instagram feed started getting more popular and there were more news stories, they started to see the potential too and agreed to the partnership. They get a royalty cut.
Port of Antwerp
What do they shoot it with? How do they get these images?
It’s specialized gear. For the cameras on the satellites, the focal length is 16-meter, which, compared to a normal DSLR camera, it’s a 32 times—the normal focal length is about half a meter. A cool factoid is that you can take a picture of a beach ball on the Golden Gate Bridge from Los Angeles in full resolution. You can capture so much rich detail.
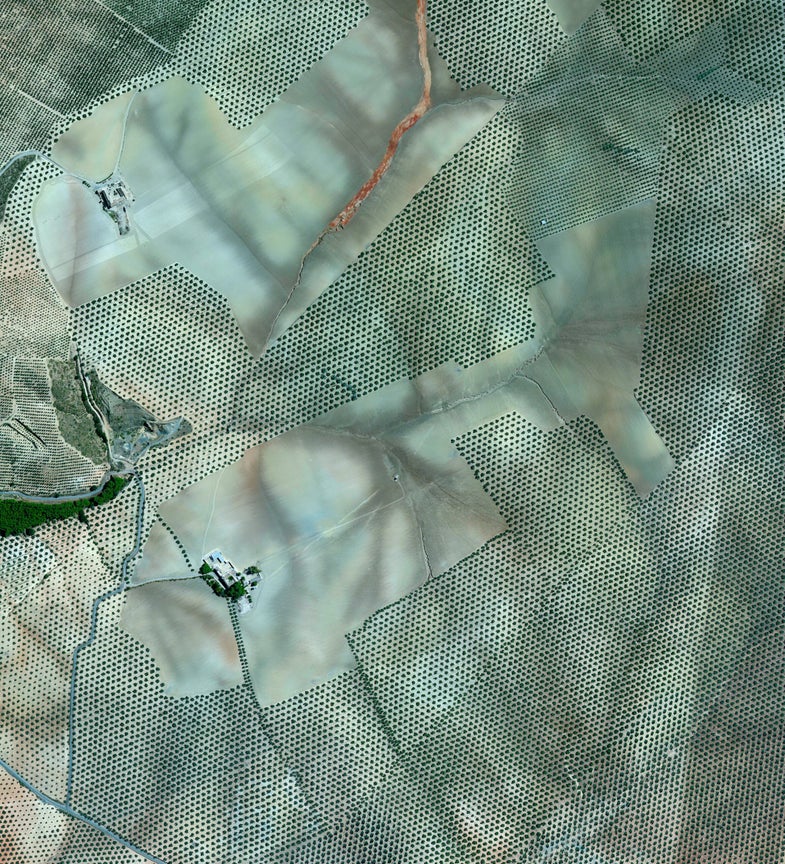
Where I think my role comes in is to figure out what is worth showing and then to do all the work after the fact to make it as easily understood as possible. By that, I mean slight enhancements on the image to make it crisper and cleaner, to bring out certain colors that help you understand what type of crop or what type of shipping container you’re seeing in the frame. A lot of the images look like abstract art at first, but then you can start to pick up familiar details and kind of ground yourself, despite the fact that you’re seeing so much area.
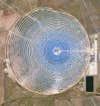
Gemasolar Thermosolar Plant
Are you using programs like Photoshop to do this enhancement?
Yeah, exactly. It’s often anywhere from 6 to 15 to 20 different satellite images that you need to pull together and Photoshop, and once that’s there, I make an artistic decision to drop it a certain way, to rotate it a certain way, and to clean it up and make it crisper.
What’s fascinating from a photographic perspective is that when you’re looking at something straight down from far away, it becomes almost two-dimensional and you lose that 3-D feel, which means there’s no up or down. For aerial photographers shooting out of a helicopter or plane, it’s pretty obvious from the horizon line what’s up and down, but with these images you can continue to rotate and still keep a correct top and bottom at all times. Which means that there’s an infinite amount of ways to present this imagery, and I kind of have the power to figure out what looks best, either in the book or online.
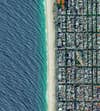
Ipanema Beach
You don’t worry about which way is north.
Right. It’s pretty funny sometimes when I post an image and there’s a comment on the page: “This is great, but it’s upside down.” People are so used to looking at the scenes on Google Earth or whatever with north orientation, but if you think about it, that’s not necessarily correct, it’s just what we’re used to. I’m concerned, from a photographic perspective, with what is most appealing.
It looks like by stitching these different squares, you can flatten out the plane. You’re showing the Earth as flat!
Well, when you’re showing a particular square or grid or one section, relatively it is flat. Once you start looking at larger swaths of Earth then you get the curvature in, but for our purpose in smaller areas relatively, there is flatness. Like with a map.
Sun Lakes
You were a history major at Yale. Did you gain some of your computer expertise in school?
With the nature of this kind of photographic medium, there really is not a lot of training. I think after doing it every day for three years my skills have improved just from creating hundreds of these images. What I learned in school that has been helpful is, I took a lot of art history classes. And when you’re trying to a find certain composition or balance or modelling it off of famous artists to find that immersive mesmerising look, you’re kind of not creating it yourself, but looking for it in the world. So all of the artists I love, in a weird way I’m modelling what they did and looking for that. I’m not a formal artist by training. But my own practice along with the studies that I did in art history and world history—in terms of researching and finding these places—all came together to make this project possible.
Olives
Were you influenced by people like Yann Arthus-Bertrand?
Absolutely. His work as well as that of Edward Burtynsky—who has surveyed mines and manufacturing landscapes and water—inspired the subject matter that I’ve focused on. And artists like Piet Mondrian worked with grid lines, or Ellsworth Kelly, or Mark Rothko, I think some of those influences come into the images, so it’s kind of a combination of those worlds.
What do you think someone like Burtynsky would say about this project? He goes out and makes his own images in the field.
Right—I have nothing but the most complete admiration for the real photographers who do go shoot and get behind the lens to actually capture the world. I think, in that regard, it’s almost a different form. My project is more curation than actual capture.
Burtynsky’s work is amazing. Comparing images taken from helicopter versus satellite, when you’re closer you can start to pick up more details that I’m unable to show. You can start to see people, specific cars on the road and things like that. But what’s different about satellite imagery is being able to show the entirety of something—like the edges of an entire mine over squares miles—and there’s stuff to be gained from each of those perspectives. Burtynsky’s work and Bertrand’s work are inspirational, and I think building on that with this technology is very powerful.
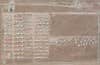
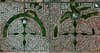
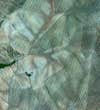
Moab Potash Evaporation Ponds
You have also organized the book into thematic sections and written intros and detailed captions.
Yes I researched those—and I think if I started out on day one and said, “I’m going to do a book and look for all these places,” it would’ve taken forever. The fact that this project was built on my blog and my Instagram feed structure, with one a day, enabled it to build on itself. It was driven by my interest in environmental issues. The way I went about finding the images was with an idea first and then a search to find it. For example, for one of the solar concentrators, the research process would be, “I’m looking for energy; I’m looking for a solar panel facility; I’ll find a list of the largest solar panel facilities in the world.” A resource like Wikipedia is indispensable for a project like this where they’ll give you a list of the largest solar panel facilities, nuclear power plants, you name it, with geo-coordinates next to them.
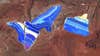
Teachers tell us not to trust Wikipedia—hope you used it as a gateway …
Absolutely! It leads you to other sources. And I go there to see, “Is this something I want to explore? Does it have an aesthetic appeal?” For the book, the images need to have that wow. mesmerizing, pull-you-in factor, and if it does, then there’s the task of summing up all the information about this one place in three to four sentences. That’s kind of the sweet spot, I think, where someone can learn a lot and also doesn’t get bored and stop reading. You can say, “Wow, what is that?” and then take 15 to 20 seconds to get the tip of information. If you want to learn more you can always look for more.
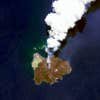
Nishinoshima Volcanic Activity
You still had your day job as a consultant when you started this project as a blog. At what point could you monetize it?
The first monetization was to get a book deal, the first form of any money coming through. And then through a sort of organic interest, a science museum in Munich, Germany, called the Deutsches Museum asked if I could make prints out of the images. At the time I had no idea how to make prints, but I said, “Yes, of course I can make prints!” and then I figured out how to do it after the fact. That’s when I started teaching myself how to stitch them together to get the full resolution.
After I got full access to the imagery archive, I started selling prints on the website, as an additional source of revenue to help me pay the bills while I was working on the book. But I was doing it for a long time without making money and I simply enjoyed the creative outlet and the research. I was continually amazed by how much following the project was getting online, so that was very fulfilling and motivational to keep it going.
Who did you turn to for the printing?
I have a printer in New York called Cloud Printing. It’s been amazing to have a partner like that who’s able to handle all the orders that come in a ship them out and kind of host all the files with them—it just kind of runs itself. Going forward, it would be great to print these images at their full true size, which can be up to eight or nine feet across in full 300-dpi resolution. That’s what I’m excited about exploring: to really bring it to life where you can get lost in these images, because there’s so much going on and they cover such a vast amount of territory. You wouldn’t be able to understand in any other way unless you’re that far away from it, which is the incredible new perspective that the satellite images allow.
